By the LEV Policy Team

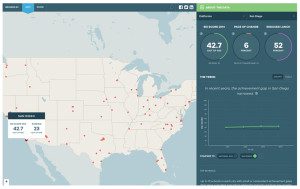
The recently released Education Equality Index takes a look at the achievement gap in student performance between low-income students and the whole student population. The report assesses the gap in 35 states and 100 large cities across the country, including Tacoma, Spokane, and Seattle. No state fared well on the index. On a scale of ‘no gap’ to ‘massive gap,’ 9 states’ achievement gaps for low-income students rated ‘large’ while the remaining 26 states have ‘massive’ achievement gaps for low-income students.
The index compares the percentage of low-income students that score proficient on a state assessment to the percentage of the entire student population that scores proficient. A rating score is then determined based on this comparison. The report authors also adjust scores “to more fairly compare schools [and states] serving a higher percentage of FRL [free and reduced lunch] students.” States with a larger low-income student population receive additional points because of the added ‘challenges’ that accompany serving low-income students. And while there are issues with comparing one student group to the whole student population, addressed here, there are larger philosophical concerns with adding points simply for enrolling large populations of low-income students.
Awarding points for having a large low-income student population sets different expectations for schools, cities, and states serving low-income students, and, ultimately, sets different expectations for the students themselves. While poverty is a challenge, we cannot claim that education is the great equalizer if we allow our systems to count different outcomes as success for different populations of students.
This report reaffirms that we have large and unacceptable achievement gaps for low-income students across the country. But it also highlights that we continue to develop measures that do not further our understanding of how to better serve those students. Adding extra points for the mere enrollment of low-income students does not push schools, cities, or states to better serve students. How do we devise a measurement that acknowledges some students will require more resources and supports, without lowering the bar for systems serving those students? How do we determine what schools, cities, and states are giving kids the extra push they need, celebrate them, and learn from them? How do we encourage systems to guide resources towards students that need them the most?