Remembering Senator Andy Hill
By Frank Ordway, guest blogger
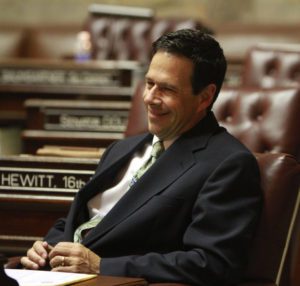 It is unfortunate that the first time I return to this blog a year after leaving the League of Education Voters is for the purpose of memorializing Andy Hill, though I can think of few people more worthy of praise and remembrance.
LEV, and my, interactions with Andy were momentous for the organization, me personally and the children of Washington state. I remember my first substantive conversation with Andy. He came to a LEV community event shortly after he was elected. We had not endorsed Andy. He arrived, unannounced, right from the soccer field. We got a cup of coffee and went to the back of the room to talk.
His first words were about how he felt there was a lot work we could do together, and was committed to doing so. We had not endorsed Andy, so I was impressed with his maneuver and commitment. We talked about the various challenges confronting the state in general and in education, and where our values aligned. We agreed on a host of things, and disagreed on many as well. But we pledged to work together on the issues where our values aligned.
Andy Hill never wavered from that pledge, and over time we were able to increase the number of items we worked on together. He played an important role in expanding opportunity in early learning, K12 and higher education. One area where we initially disagreed related to the College Bound Scholarship program, but after long talks about the results, he supported the program. Andy was always open to ideas and data.
All too often, the confines of political party membership limit both politicians and advocates. People refuse to work across the aisle; people refuse to give credit to members of parties they oppose, even when they are right. I, and LEV, was able to escape this trap with Andy and get meaningful things done for the students and parents of Washington state in a bi-partisan fashion.
He was the model of quiet, determined leadership. Anchored in his values, he knew the right thing to do for him and was comfortable with his decisions, even when they were not in alignment with his party or advocates like me. I will always remember and be thankful for that attribute.
In my last conversation with Andy, which was regrettably via text, I told him I was praying for him and his family. I also told him to kick cancer’s ass. In addition to thanking me, he said, “That’s my plan.”
He may have lost the battle against cancer. All one can do is control what you can and, where Andy had influence, our state benefited greatly.
We will miss you Andy, but your legacy and approach to public service will be remembered by all of us lucky enough to work with you.
With great admiration and respect,
Frank
 The League of Education Voters has long argued that a child’s education should be a continuum with seamless transitions from early learning through higher education. We have worked with partners around the state in pursuit of that vision, including with the
 It was the day that Jane was brought into the principal’s office to be scared by a police officer for threatening other kids that sent me over the edge. She was in the eighth grade, being bullied, and in a downward spiral of discipline without direction or objective. I walked into the principal’s office and told him if he ever did anything like that again without calling me first I was going to sue everyone in the district. “There is a long line of people who’ve let this kid down,” I said, “and you are one of them.”
 Rogers High School
 The Rural Alliance for College Success was recently awarded a
  Chris Korsmo, CEO of the League of Education Voters, submitted an op-ed to The Seattle Times‘ Education Lab yesterday. It was published in The Seattle Times print edition on June 20.